Like it or not, most of us have had to become a lot more conversant in the data of epidemiology over the last couple of years. Concepts like case positivity average, ICU bed capacity and community vaccination rate all have to be weighed in making daily decisions like whether or not to go to a movie, have dinner with friends or visit grandma.
The good news is that the state of Minnesota makes all this data and more available in regularly updated, readable dashboards. The bad news is that these data are spread across several different dashboards on different Department of Health websites, many of which don’t link to each other.
To help make sense of it all, here’s a guide to all of the state of Minnesota’s regularly updated COVID-19 data: what it tells you and where to find it.
The basics: How many new COVID-19 cases were reported today? How many tests? How many deaths?
This information can be found on the Minnesota Department of Health’s COVID-19 Situation Update page, which is updated every weekday just after 11 AM. Besides the overall counts of new cases, tests and deaths, this page also provides details like the counties in which new cases
and deaths occurred, or the age groups of those getting sick and those who have died.

One word of caution with case and test data at this point in the pandemic: the data shown here on cases and tests are not a complete picture, because they don’t account for at-home tests or cases that result from them.
Another measure of that corresponds to the current prevalence of the virus is the level of COVID-19 virus found in Twin Cities wastewater. That’s measured by the Metropolitan Council and can be found on its COVID-19 wastewater surveillance page.
What about the rate of positive COVID-19 tests?
Even though the Situation Update page contains data about the number of tests conducted and the number of new cases identified by those tests, that page won’t tell you the rate of positive tests, or case positivity rate. Absent more comprehensive measures of viral spread, the case positivity rate has often been used as an overall indicator of how prevalent COVID-19 is in the community, with a rate over five percent indicating a concerning rate of viral spread (as of publication, the rate was sitting at 19.2 percent).
To find the state’s official case positivity rate, check the Public Health Risk Measures dashboard, formerly known as the “Dial Back Dashboard.” Note that the data on case positivity lag by a week or more; this story is being published on February 4 but the latest case positivity rate on the risk measures dashboard is from January 24. And, as noted above, at-home COVID-19 tests are not part of this figure.

In addition to the case positivity rate, the risk measures dashboard has charts showing the average rate of increase in new daily cases, the average rate at which people are taking COVID-19 tests (excluding at-home tests) and the rate of new hospital admissions for COVID-19. All are reported with the same lag time as the case positivity rate.
How many people are in the hospital right now with COVID-19?
The best place to find information on current hospitalizations is yet another dashboard, the COVID-19 Response Capacity dashboard. The charts and tables on this page show the number of people hospitalized and in intensive care in Minnesota, and whether the reason for hospitalization is COVID-19 or some other cause. The data are updated daily, though data from the past week may change as the numbers are corrected.

This dashboard also shows the number of hospital beds available (both pediatric and adult) and in what regions of the state.
How about how many people have been vaccinated against COVID-19?
You’ll be wanting the Vaccine Data dashboard. This data visualization has multiple charts and tabs that let you slice up the state’s vaccination data by various groupings, like county and age group.
Under the “Who’s getting vaccinated” tab, you can see a chart with rates by county, plus the data is listed by age group.

The “Race and ethnicity” tab has a breakdown of vaccination data by race and ethnicity (you can also sort by age group).
The “Vaccines administered” tab shows you how many doses of each manufacturer’s vaccine have been given in Minnesota. This tab also includes the number of booster shots administered in the state.
One big vaccine question that isn’t answered the the Vaccine Data dashboard: boosters. For that, the best you can do is head over to the Centers for Disease Control. With the options at the top, select “People” (not “Total Doses”), then select “Booster dose” and any other age group you want to look at.
What about breakthrough infections?
Information on people who were fully vaccinated but still got COVID-19 is available on MDH’s Vaccine Breakthrough website. It’s updated weekly on Mondays.

Important to note, the data on breakthrough cases is no longer all that accurate because so many people are testing at home (meaning those results aren’t reported to the state).
How do I find out which schools and congregate care facilities have had cases?
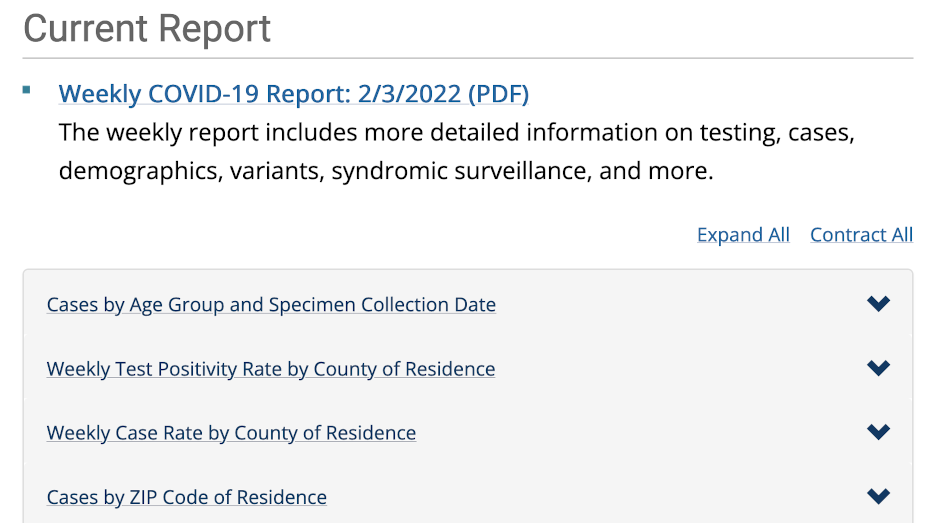
MDH’s COVID-19 weekly report page, which is updated on Thursdays at 11 a.m., has a list of schools and congregate care facilities with outbreaks of COVID-19.
For schools, the data include the names of schools with five-plus cases in students or staff IF they were physically in the building within the two-week reporting period. It also includes a range that gives an idea of how many cases were reported. If a school is listed, it doesn’t necessarily mean transmission is ongoing.
The congregate care data show cases that have had a case in a resident in the last 14 days. The list does not include facilities with fewer than 10 residents.
The weekly COVID-19 report also includes breakdowns on cases, hospitalizations and deaths by age, and by race and ethnicity. Also: child case and hospitalization rates; case counts in long-term care; in Pre-K-12 settings; on college campuses; potential childcare exposures; infection rates by county over time.
Did we miss a source of COVID-19 data that you regularly rely on? Let us know about it in the comments or by emailing gkaul@minnpost.com and we’ll add it to this list.


0 Commentaires